x
x


- Home
- Product
- Technology
- Knowledge
- News
- About Us
- Contact
- Schedule a demo
Link internal company data with media content from all over the world to determine connections between changes in your own company and current news, and thus create impressive analyses.
Advantages of implementing broadcast information in your BI tool:
The eMM Broadcast Data Cubes can be easily implemented in your existing BI tool. This not only saves you the switch to an unfamiliar user interface, but also enables you to immediately start your analysis.
The Data Cubes are available for all nine industry sectors, as defined by the World Economic Forum:
Media information has a huge impact on internal company decisions and activities in various industries - although often not obvious at first sight. This changes with BI by eMM, because the implementation of media data in your existing BI tool saves you from having to manually link internal and external information. You can immediately see the impact that media reports and news from around the world have on your company or industry.
The Data Cubes can be implemented in any common BI tool such as:
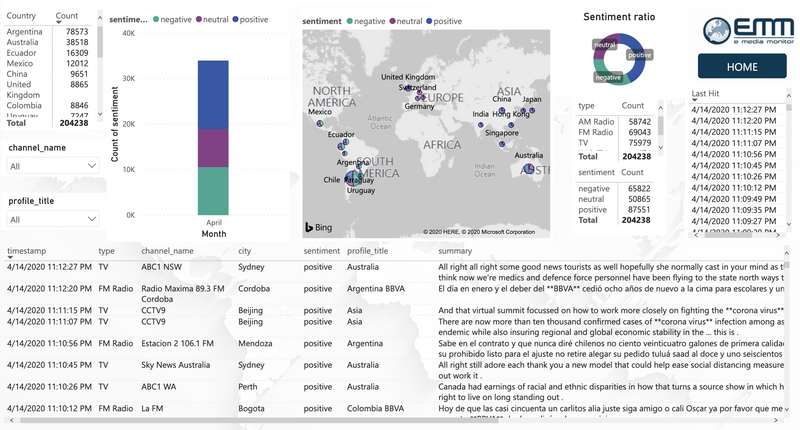
eMedia Monitor makes use of advanced technologies to search thousands of radio and TV stations worldwide for information relevant to specific industries. These are processed in real time and prepared for further use. To do this, the data are run through several procedures such as data mining, normalization, sentiment analysis or polarity detection. The information is then fed into your BI tool, where it can be directly incorporated into your analysis.
Keep an eye on current trends, international news and their effects on your company – it‘s easier than ever!
Book your free demo now: